Drawing Graphs With a Twist
With our statistics ready to be consumed, we should be able to share them with everyone. To do so we’ll use Vegalite and update the graphic information dynamically as new people join. A mix of Javascript and Elixir that will make some really cool magic.
Do not forget that all of the code from this post and others is in this repository.
Vegalite takes care of you
One of the tricky things of graph design is the specification to draw it. If you look into the Vega specification you might get scared! That’s where vega_lite can help us! We’ll use it to build the specification that Vega receives and knows how to draw a graph.
So after you add vega_lite dependency to your mix.exs file, you need to fetch the data and build the specification, will use a new LiveView Component as an example in the path lib/blog_web/live/components/dashboard_live/index.ex:
defmodule BlogWeb.DashboardLive.Index do
  use BlogWeb, :live_component

  alias Blog.Posts
  alias Blog.Statistics

  @impl true
  def update(_, socket) do
    metrics = Enum.map(Posts.list_post(), fn title -> %{x: title, y: Statistics.fetch(title)} end)

    spec =
      VegaLite.new(title: "Visits", width: :container, height: :container, padding: 5)
      |> VegaLite.data_from_values(metrics)
      |> VegaLite.mark(:bar)
      |> VegaLite.encode_field(:x, "Title", type: :nominal)
      |> VegaLite.encode_field(:y, "Views", type: :quantitative)
      |> VegaLite.to_spec()

    {:ok, push_event(socket, "draw", %{"spec" => spec})}
  end

  @impl true
  def render(assigns) do
    ~H"""
    <div style="width:80%; height: 500px" id="graph" phx-hook="Dashboard"/>
    """
  end
end
And now we load it into our view in lib/blog_web/live/open_dashboard_live/index.html.heex:
<.live_component module={BlogWeb.Components.Dashboard} id="dashboard" />
We setup the render which determines the container of the graph which has a really important detail: phx-hook attribute which defines that this specific container is the target container for this hook which we will see later in more detail.
As for the specification, lets go step by step on what happens:
- Get the data ready for a X and Y axis
- Start a new VegaLite specification with some metadata
- We choose bar graphs
- Set the X axis to be of nominal type
- Set the Y axis to be of quantitative type
- Build the spec
- Push the event to our JS code
Wait… Push the event to our JS code ?! Yes… Let’s see what we need to build on the Javascript side 👀
Draw it up
First we create our new Hook in assets/js/hook/dashboard.js which is where we actually build our graph:
import vegaEmbed from 'vega-embed'
const Dashboard = {
  mounted() {
    this.handleEvent(`draw`, ({ spec }) =>
      vegaEmbed(this.el, spec)
        .then((result) => result.view)
        .catch((error) => console.error(error)),
    )
  },
}

export default Dashboard
And then we start our live socket in assets/js/app.js with the new Hook:
import Dashboard from './hook/dashboard'

let params = { _csrf_token: csrfToken }
let hooks = { Dashboard }
let liveSocket = new LiveSocket('/live', Socket, { params, hooks })
And that is it! We now have a beautiful graph:
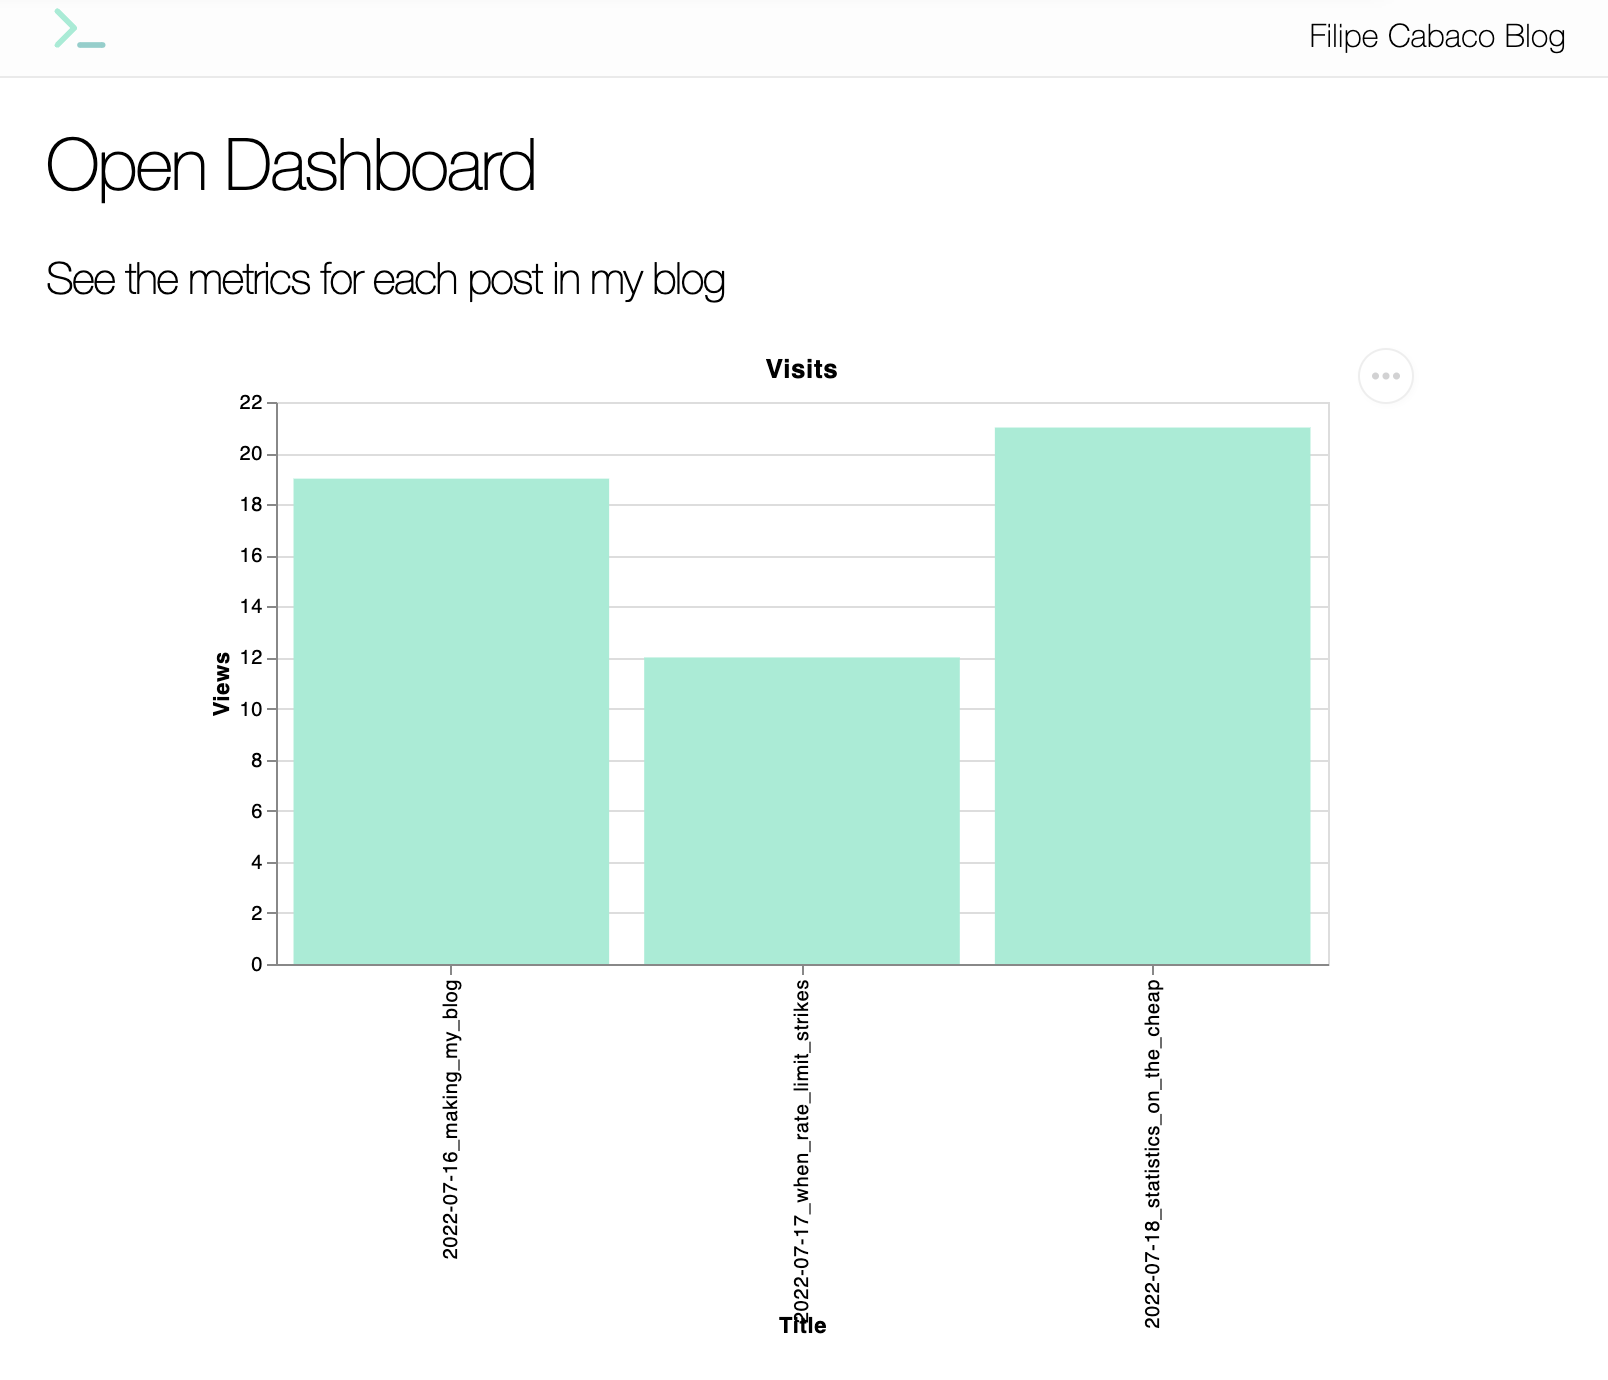
Update it!
Now comes the really fun part… Make it update by itself because we have better things to do!
First we need to go back to our component and re-use the PubSub we built for “Statistics on the cheap” and we will react to those events to send updates to our component so it can fetch the new values and draw it.
To achieve it’s actually quite simple, we just need to warn our component that something changed and that is achieved by receiving the PubSub event on the parent view in lib/blog_web/live/open_dashboard_live/index.ex:
defmodule BlogWeb.OpenDashboardLive.Index do
  use BlogWeb, :live_view
  alias BlogWeb.Components.Dashboard

  @impl true
  def mount(_params, _session, socket) do
    BlogWeb.Endpoint.subscribe("show")
    {:ok, socket}
  end

  @impl true
  def handle_info(%{event: "join"}, socket) do
    send_update(Dashboard, id: "dashboard")
    {:noreply, socket}
  end

  def handle_info(_, socket), do: {:noreply, socket}
end
Which is enough for everything to work! Our parent view upon receiving an event from our PubSub of type join sends an update to our Component which has the id dashboard.
Please do check “Statistics on the cheap” to understand the PubSub section which is where most of the magic actually happens.
In the end it looks like this when updating:
Conclusion
- Vegalite makes it easy to prepare the specification for your graphs
- Sending events from Elixir to JS is quite simple with Hooks
- Updating can be done by having the Parent view receive the signal and warning the target Component to update